
Markets are a chop fest.
Since February, the S&P 500 (SPY) has fallen 11% from its all-time highs, while the Invesco QQQ Trust (QQQ) has plunged 13%.
It looked like markets were trying to stage a recovery last week after a Zweig Breadth Thrust was triggered, which only happens when many stocks rally over a short period.
But this week, we’re back in the red.
With volatility still running hot, I want to take today to share how I’m trading in this environment.
Longtime readers might be familiar with my Express Trader advisory. In it, I use my proprietary PRO Meter to answer an important question: “Is it time to play offense or defense?”
I’ve never shared an extended breakdown of my PRO Meter here before, but if you want to know exactly how I’m navigating the chop—and how to get on the right side of today’s market—keep reading.
First, let’s talk about the most important question traders need to ask themselves…
- “What kind of environment are we in?”
I ask myself this before I even think about which individual stocks to own.
Sounds simple, but traders who get this question right—consistently—are the ones who come out on top.
That’s why my process each week begins with evaluating the overall market.
If markets look set for a strong week, I’ll get aggressive and bet on an explosive sector, like tech.
If markets look iffy, I’ll be more conservative and only look for stocks that can perform well even if the indexes are treading water.
And if markets look weak, I’ll batten down the hatches and look for pure defensive trades like dollars, utility stocks, or certain types of bonds.
If there’s one thing I’ve learned, it’s that “forcing” trades is a recipe for disaster. There are times to profit, and there are times to protect your capital.
Rookie traders who try to profit when they should be focused on protecting their positions will learn this painful lesson.
You have to let the market come to you.
- To answer the question, “What kind of market environment are we in?”, I created the PRO Meter.
It boils down the market action into one line on a chart.
From this, I can determine whether the bulls or the bears are in control of prices.
Without getting too in the weeds, the PRO Meter compares the performance of “risk on” sectors with “risk off” sectors.
The risk-on group includes the following sectors: technology, communications, consumer discretionary, industrials, and financials.
The risk-off group includes: consumer staples, utilities, and healthcare.
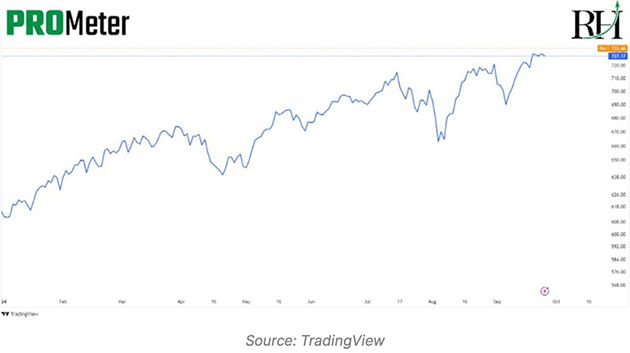
The PRO Meter is effectively a ratio between these two groups, depicted as a simple line chart.
When this line is rising (like below), it means risk-on groups are outperforming risk-off sectors. This is when I want to get aggressive.
When this line is trading sideways, that can indicate indecision. It’s time to exercise patience and wait for the market to show its direction.
When it’s falling, that’s my signal to exercise caution.
- I’ve used this simple line chart to profit from—and protect—my trades going back to 2021.
Here’s a quick overview of how the PRO Meter has influenced my decision-making over the past four years…
2021: It was clearly a “risk on,” moneymaking environment. I pressed my bets in tech stocks and other explosive sectors and collected strong profits.
But look at what happened at the end of 2021...
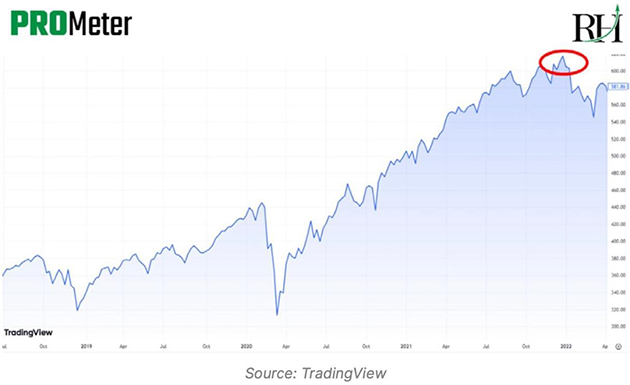
The PRO Meter exhibited a “false breakout”—a potentially bearish pattern that suggested it was time to get cautious.
Sure enough, markets sold off soon after. The PRO Meter was clear: 2022 was likely to be a rocky year... and it was.
2022: This turned out to be the worst year for the financial markets since 2008.
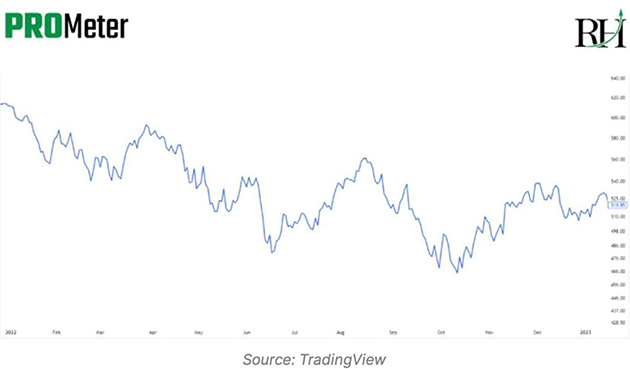
Thanks to the PRO Meter, I stayed defensive and mostly recommended energy stocks, which aren’t overly correlated with the overall market.
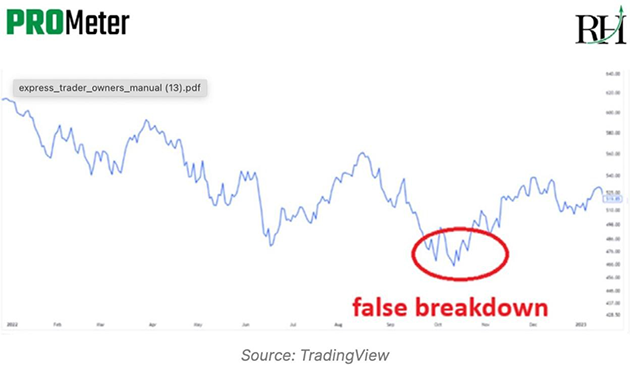
2023: Toward the end of 2022, the PRO Meter put in a “false breakdown,” the exact opposite of the bearish signal I saw in early 2022.
This was my first clue that the market was about to turn bullish.
Sure enough, 2023 was a great year for stocks. I shifted back to playing offense and enjoyed a very strong year.
2024: This was another strong year for stocks. That entire year, the PRO METER was moving up and to the right. It was a clear signal to be long “risk on” stocks.
As you can see, the PRO Meter is a guiding light that can orient you on how to approach the market each week.
- What’s the PRO Meter saying today?
I’ve used it to take a mostly defensive stance over the past couple of months, focusing on leaders.
Last week, it crept higher, showing that “risk on” stocks were outperforming “risk off” stocks.
But as I told my Express Trader readers:
There’s no guarantee a V-bottom recovery will happen in US stocks.
While we have to be open to all possibilities, for now, I still think the best way to play this market is to focus on names displaying relative strength.
To sum it up, caution is still warranted. And it’s time to be selective about the trades you do put on.
Of course, one week’s worth of analysis isn’t enough to get the full scope of the entire market. But layered together over time, these weekly readings from the PRO Meter reveal key patterns… and can help you adjust before the market makes its next big move.
If you’d like to know exactly what my PRO Meter is saying each week—and get my three strongest trades based on these readings—you can join us in Express Trader here.
Justin Spittler
Chief Trader, RiskHedge