

I have a confession to make…
I used to be a “gold bug.”
For years following the 2008 financial crisis, I was convinced America would go bankrupt due to its ballooning debt levels… which would send the value of the US dollar to zero and the price of gold skyrocketing.
Of course, that didn’t happen.
Yes, the US is still in massive debt. And inflation is well above normal levels.
But gold hasn’t budged over the past decade. It’s trading at roughly the same price it did in 2011.
I stopped being a gold bug around 2015. But I still trade it when it looks good. And gold looks GREAT today.
Gold’s up 7% this year. And last week, it briefly crossed $2,000/ounce—flirting with a record high.
This recent action tells me it could be setting up for a big, sustained move higher. I’ll share exactly how to play it in today’s Trade of the Week.
As you can see, SPDR Gold Shares ETF (GLD)—which tracks the price of gold—has spent over a decade building a massive “cup-and-handle” pattern:
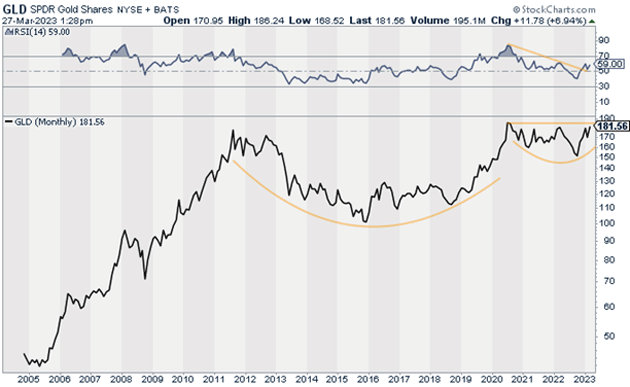
Source: StockCharts
This is arguably the single most bullish trading pattern. When the price breaks above the “handle,” the pattern is complete, and the uptrend continues.
Three “big picture” trends also point to much higher gold prices:
#1: The US dollar has pulled back.
The US Dollar Index has fallen 10% since September. That’s a huge move for the world’s most important currency.
And it’s likely headed lower.
The US Dollar Index has been trading below its 200-day moving average since November… indicating it’s no longer in an uptrend.
This is great news for commodities like gold, which are priced in dollars.
In short, a weaker dollar would relieve a lot of downward pressure on the price of gold.
#2: Interest rates are also likely headed lower.
In October, yield on the 10-Year Treasury peaked. Since then, it’s been putting in lower highs and lower lows.
This is a big deal.
Gold doesn’t pay a yield like bonds. So, it becomes more attractive when rates fall.
#3: “De-dollarization” efforts are ramping up.
Last week, Russia announced it will use the Chinese yuan to trade with Asia, Africa, and Latin America. Saudi Arabia is also in talks with China to do the same.
These “de-dollarization” efforts accomplish two things. One, they reduce demand for dollars. Two, they fuel geopolitical tensions, which boosts demand for gold.
In short, there are plenty of reasons to expect higher gold prices. But I’m not recommending gold coins or GLD today.
Instead, I encourage you to buy the VanEck Vectors Gold Miners ETF (GDX), which invests in a basket of gold miners.
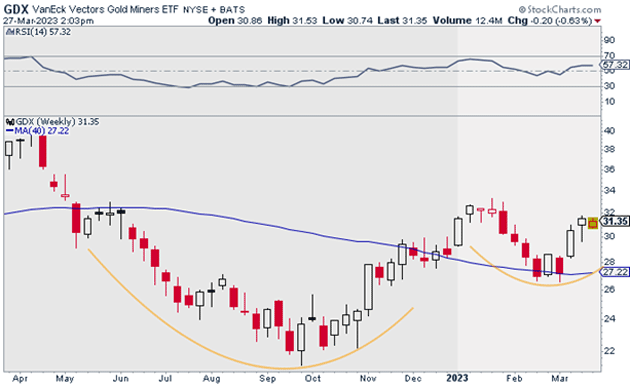
Source: StockCharts
I like this trade because gold stocks have some serious catching up to do relative to the price of gold.
You can see what I mean below. This chart compares the price of GDX relative to GLD.
This ratio is putting in a cup-and-handle bottom formation on a relative basis. That indicates gold stocks should outperform gold going forward.
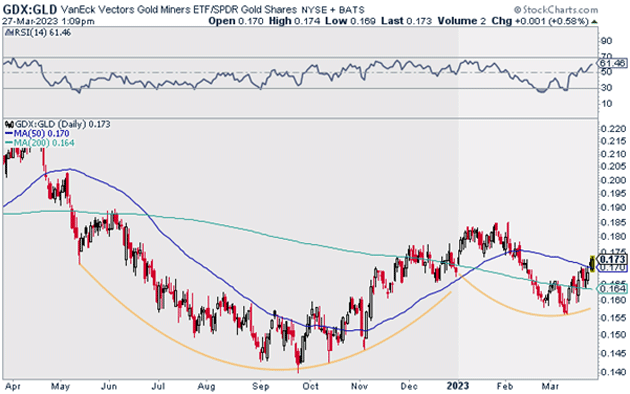
Source: StockCharts
Keep in mind, gold miners are leveraged to the price of gold. During the right conditions, they can outperform the price of gold by two or three times.
I could see GDX making a run of $40 to $42 rather quickly and higher in time, giving us a minimum risk-reward ratio of over 2:1 on this trade.
Action to take: Buy GDX at current market prices.
Risk management: Exit your position if GDX closes below $26.50. This limits our downside to around 17% based on today’s prices.
Justin Spittler
Chief Trader, RiskHedge