

Some statistics—while technically correct—are wildly misleading.
Let me give you an example.
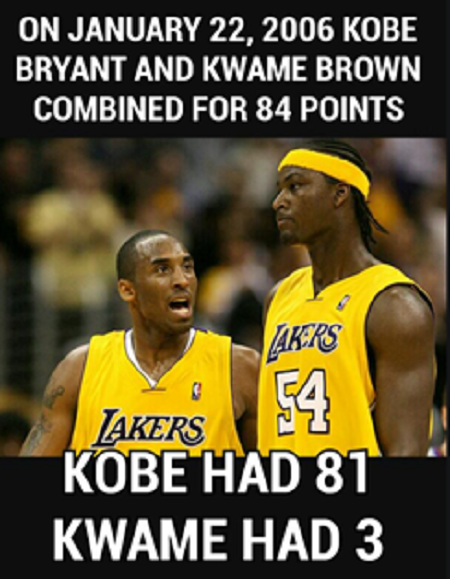
On January 22, 2006, one of the most memorable basketball games in history took place.
Legendary Lakers player Kobe Bryant and center Kwame Brown combined to score (84!) points against the Toronto Raptors.
If you don’t follow the NBA, you may think both guys scored around 40 points.
Nope.
Kobe poured in a whopping 81 points—good for the second-highest total in NBA history.
Kwame scored 3.
Now, this is just a harmless example. It even became a popular “meme,” as you can see...
 Source: ifunny.co
But I bring it up for an important reason:
When it comes to investing... there are many misleading stats that get repeated over and over and over again.
And if you don’t have proper context for them, you’ll end up making bad decisions with your money.
Blindly following a “true but misleading” stat can make building wealth a whole lot harder than it needs to be.
Today, I’m going to show you the #1 most dangerous “stat” in investing.
I bet you’ve heard it dozens of times before. And by the end of this essay, I hope you’re ready to toss it out the window...
And focus on something 100X more important, as I’ll explain.
Here it is:
- “US stocks have risen 8% every year, on average, for the last 100 years.”
Technically true.
Dangerously misleading.
And look, it’s no secret why this is repeated over and over...
Financial advisors like to use this stat to make you feel comfortable and secure.
They’d love for you to assume stocks have a clean, 100-year track record of consistently rising 8% a year… year in, year out.
That would be nice, wouldn’t it?
If US stocks were predestined to keep rising 8%/year, on average, forever?
Of course... that is not how the stock market works.
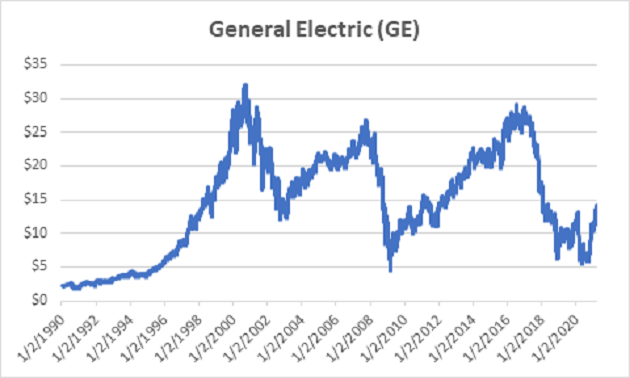
- Take General Electric (GE), for example…
Look at the chart below.
 Source: Yahoo! Finance
Technically, it’s not a lie to say…
“GE is up more than 400% over the past 30 years…
Which is good for an average of over 10% a year.”
True, but very, very misleading.
Because GE stock gained roughly 3,000% from 1985–2000...
Then lost around 60% from 2000 – today.
Apply this to the whole stock market, and you’ll see the same thing...
There are decades like the 1920s, ‘50s, and ‘90s when US stocks soared well over 200%...
And there are decades like the ‘30s and 2000s... when US stocks barely treaded water... and lost significant ground after factoring in inflation.
Sure, when you average it all together, you get 8% a year.
But that’s a useless piece of information if you’re planning on retiring in, say, 10–20 years.
Its 100X more important to know: What kind of stock market environment are we in today?
Are we in a time to be cautious like the 2000s... when investors should be playing defense?
Or are we in a time of great opportunity, like the 1990s—when you should be getting aggressive?
- If you watched Stephen McBride’s presentation, you know we’re at an inflection point in the markets today…
Specifically, Stephen believes we’ve entered America’s fourth “wave” of disruptive innovation…
And this should lead to a stock market boom similar to the 1950s or 1990s.
According to Stephen:
Every week we’re getting new breakthroughs in genomics, self-driving cars, edge computing, artificial intelligence, synthetic biology, you name it. This new wave of disruptive innovation is, hands down, the biggest and most transformative America has ever seen.
So… what does this all mean for stocks? Well, we’ve only seen 3 true “waves” like this over the past 100 years. And each one sent stocks into a frenzy…
Stephen’s message is extremely important. If you didn’t get a chance to see his presentation, we’ve made a transcript available until tonight only.
- So… just how lucrative were these previous 3 waves?
Remember, there have only been 3 major waves in the past 100 years.
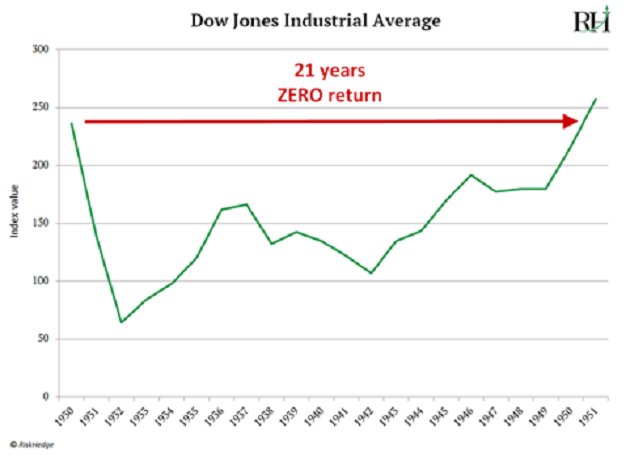
The first wave happened in the 1920s… when mass car ownership changed the world.
People who bought the right stocks collected returns as high as 700% and 1,200%, in relatively short periods of time.
But look what happened after:
The markets went nowhere for 21 years.
 Source: Macrotrends.net
21 years... zero returns!
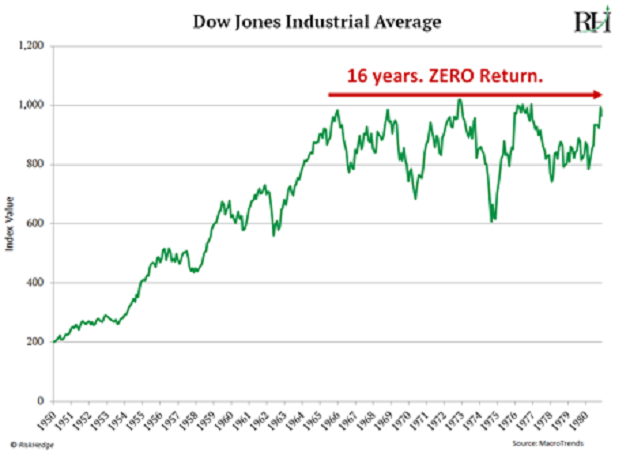
The next wave came in the ‘50s… when World War II ended and the computing revolution was born.
Just like in the ‘20s… after a massive run-up, markets stagnated for the next 20 years.
 Source: Macrotrends.net
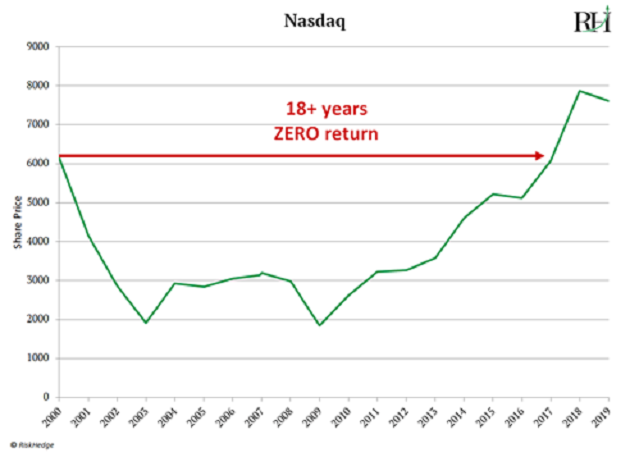
Same thing in the ‘90s.
The Nasdaq skyrocketed 10X in the 1990s during the internet boom.
But when it ended... the Nasdaq returned precisely 0% for the next 18 years, when accounting for inflation.
 Source: Macrotrends.net
In other words, after the wave ended... the Nasdaq returned zilch for the next 18 years.
- Can you see why that 8%/year stat is wildly misleading?
In markets, you need to be conservative at certain times... and aggressive in other times.
Getting this right is key.
Remember, there have been 3 distinct periods when stocks have BOOMED…
Followed by 20-year periods when stocks went practically NOWHERE.
Right now, few Americans can afford to earn zero on their investments for 20 years.
Our suggestion is to make the most of this fourth wave... so you’re in a strong financial position when it ends.
As Stephen says: “Now is the time to be aggressive in markets, if you can afford it.”
If you’re interested, go here to get Stephen’s playbook for the 4th wave.
When you do, you’ll see that you’re eligible for a $200 voucher toward Stephen’s research.
Warning: This voucher, and the 50%-off deal that we’re currently offering on top of it, expire tonight at midnight.
So be sure to review your deal here and make your decision before midnight tonight.
Thanks for reading,
Chris Reilly
Executive Editor, RiskHedge