
The economist John Maynard Keynes once said, “The market can remain irrational longer than you can stay solvent.”
We’re three years into the artificial intelligence (AI) boom, and I see a lot of people already suffering from investing fatigue. They talk about AI like it’s old news. Like the boom is already behind us.
I’d remind them: disruptive megatrends last decades. The hardest thing about making money from megatrends isn’t the buying. It’s the holding on and staying interested.
My spin on Keynes: “Winners can keep on winning longer than you can stay curious.”
- AI has dominated markets since ChatGPT launched in November 2022.
It transformed Nvidia (NVDA) into the world’s largest company and added trillions of dollars to the US stock market.
It single-handedly brought nuclear energy back from the dead and turned boring old utilities into the hottest stocks on Wall Street.
And it gave us the world’s first-ever $500 billion private company: OpenAI.
AI is undoubtedly the disruptive megatrend of this decade. Want proof? Look at what’s changed in just six years…
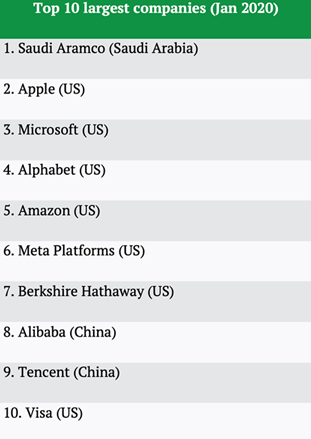
These were the 10 largest companies in the world in 2020:
Compared to the 10 largest companies today:
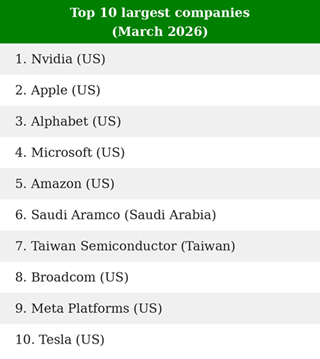
Berkshire Hathaway (BRK.B), Alibaba Group Holding Ltd. (BABA), Visa (V), and Tencent are out… while Broadcom (AVGO), Taiwan Semiconductor (TSM), Tesla (TSLA), and Nvidia are in.
What do those four have in common? They’re all riding the AI wave.
- AI isn’t slowing down, but the bottlenecks are moving…
I know AI feels a little long in the tooth. No money manager sounds smart for saying, “I’m bullish on AI.”
But to paraphrase a hedge fund friend of mine: “Do you want to sound smart, or do you want to make money?”
My research tells me we’re still early in the AI buildout. But here’s the thing: The bottlenecks are shifting. And which stocks you want to own are changing right along with them.
First, it was GPUs—the chips that process billions of calculations every second so ChatGPT can respond to you. Every data center owner needed pallet loads of Nvidia chips.
The more computing power you had, the harder your AI could “think.” ChatGPT kicked off a global chain reaction of spending on computing power, and Nvidia became the world’s most valuable company.
|
Yet the rush to snap up Nvidia chips opened a new bottleneck: connecting all those GPUs. What good is a billion dollars’ worth of chips if they can’t talk to each other? Networking stocks became the next gold rush.
Then came power. Data center operators realized that buying GPUs and connecting them in giant racks was actually the easy part. Powering those energy-hungry AI racks was the new problem. Nuclear energy—once written off—came roaring back.
Then spending shifted to memory. Training better AI models means feeding them more data at a faster rate. Memory chips—the devices that “feed” data into GPUs—became the next bottleneck.
High-bandwidth memory, which moves data 10X faster than traditional memory, exploded in demand. Memory prices tripled in just a few months. The commodity that everyone once took for granted became the scarcest resource in tech.
- Each time a bottleneck gets cleared, a new one opens up…
As investors, there’s money to be made in identifying where the goalposts are shifting before everyone else piles in.
Right now, AI spending is moving down the stack once again. The companies worth watching aren’t the household names. They’re the picks-and-shovels players—the ones building the infrastructure that makes the whole system run.
Today, that shift is pointing directly toward semi-cap companies: the ones that build the machines used to manufacture AI chips.
As chip demand explodes, the real constraint isn’t the chips themselves… it’s the ability to produce them at scale.
That’s where the next wave of capital is flowing.
The boom isn’t over. It’s just shifting.
Stephen McBrideChief Analyst, RiskHedge